Graphs
Arches v3.0 Graphs
- Arches v3.0 Graphs: Zip file of PDF files (5 graphs in both A4- and Letter-size; Heritage Resource graph also in B4- and Legal-size)
- Arches v3.0 Graphs: Zip file of GEPHI files
- Free Gephi Download
The Arches graphs are the visualizations of the data relationships that exist in the Arches system. These relationships are based on a mapping of the CIDOC Conceptual Reference Model (CRM), an ontology focused on cultural heritage (ISO 21127:2006), to the draft International Core Data Standard for Archaeological and Architectural Heritage (CDS), which is now being finalized by CIDOC, the International Committee for Documentation of the International Council on Museums. For more information on the CIDOC CRM and CDS and their application to Arches, please visit the Arches Standards and Interoperability page.
Please note that all graph information is not necessarily represented in the system. These graphs are provided as documentation for database administrators and as reference for interested Arches users. The beauty of the Arches interface is that the relationships depicted in the graphs is seamlessly integrated into the system and that most users do not need to reference the underlying system ontology.
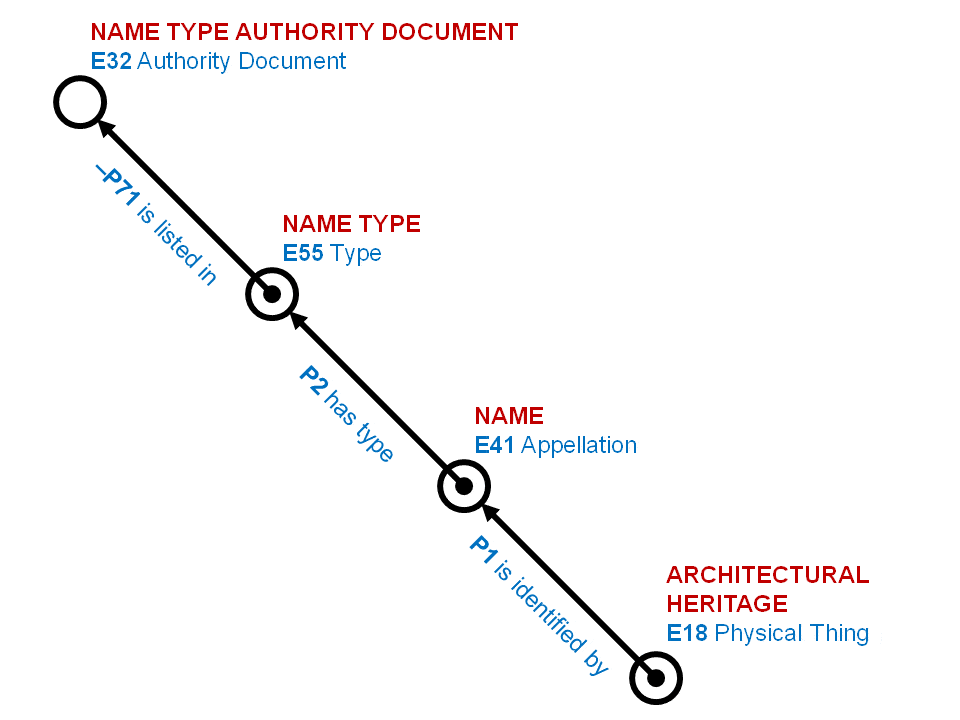
Typically, data graphs consist of two main elements: nodes and edges. Nodes represent the concepts in a data structure, while edges represent the relationships between the concepts. Each node in the Arches graphs corresponds to a CIDOC CRM Class number, and each edge refers to a CIDOC CRM Property number. Each CIDOC CRM Class number is prefaced with an E (e.g., E55 for “Type”), while each Property number is prefaced with a P (e.g., P2 for “has type”). A Property number further prefaced by a minus sign represents the inverse value for that Property number. In the example below, -P71 represents “is listed in”. The value for P71 without the minus sign is “lists”.

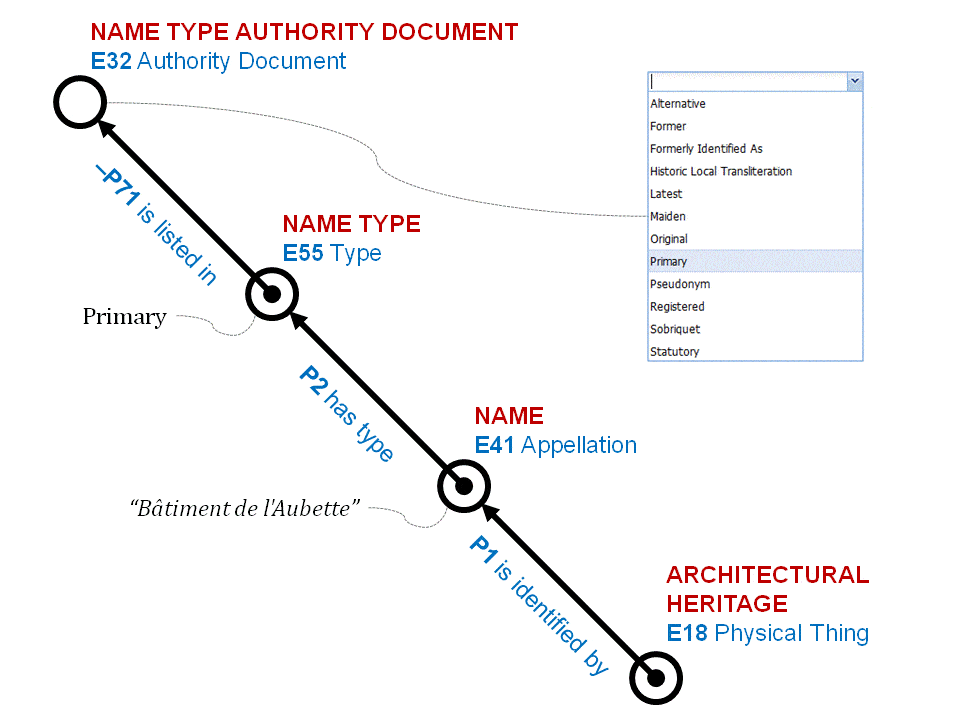
How this relates to the Arches system interface is shown in the next diagram, where the Name (CIDOC CRM Class E41 Appellation) is “Bâtiment de l’Aubette”, the Name Type (CIDOC CRM Class E55 Type) is “Primary”, and the Name Type Authority Document (CIDOC CRM Class E32 Authority Document) represents the drop-down controlled vocabulary for Name Type.

The graphs are provided in both PDF and editable GEPHI file formats. Gephi is an interactive visualization and exploration platform for all kinds of networks and complex systems, as well as dynamic and hierarchical graphs. It is available for free download at https://gephi.org/.
Last updated: June 2017